Check the log
Lets say you are running console command something like
bin/console in docker container (to those who do not know – it is symfony console command).
Enable logging. I think I myself underestimate the benefit of it. Yes, those logs show lot of spam which is hard to understand but sometimes you can see some useful things. If using xdebug 2, to do that, add to your php.ini for example
xdebug.remote_log=/tmp/xdebug.logThen I rebuilded container using
docker-compose up --buildNot sure if this is needed, maybe somehow can restart php server – but need somehow to make changes of the php.ini work.
To see the logs, you need to go into docker container. You can find here how to do that https://stackoverflow.com/questions/30172605/how-do-i-get-into-a-docker-containers-shell
and see the contents of the file you set in the config xdebug.remote_log.
Can xdebug connect to client?
Check if you see in the log something like
[16] W: Creating socket for ‘192.168.128.11:9001’, poll success, but error: Operation in progress (29).
[16] E: Could not connect to client. 🙁
It might be that ip address is wrong. You need IP adress of your host machine. On Ubuntu I got it with this command:
ip addr showI am not sure exactly which one to choose, this command gives few of them. In my last case this one worked: 192.168.31.26 . I think you can also try those which start with 192 first. Put the address in php.ini config (xdebug 2):
xdebug.remote_host=192.168.31.26and make sure php see this value (by rebuilding container for example).
Cannot parse server name for external Xdebug connection
Another problem I had – PhpStorm was showing in the event log:
Cannot parse server name for external Xdebug connection.
To fix it create environment variable PHP_IDE_CONFIG on the remote server.
Windows: set PHP_IDE_CONFIG=”serverName=SomeName”
Linux / Mac OS X: export PHP_IDE_CONFIG=”serverName=SomeName”.
It worked to go to docker container shell and run that suggested export. I think need to run it each time container is started if you want xdebug from cmd to work. Probably there is better way but so far only this one I found.
SomeName has to be replaced with value from field Name in PhpStorm:
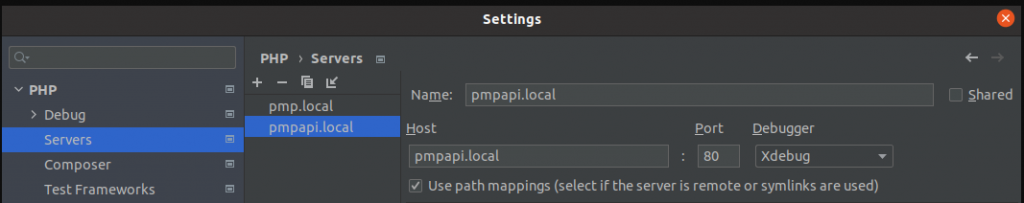
so for example in my case I need to run in linux
export PHP_IDE_CONFIG="serverName=pmpapi.local"How to make xdebug stop on breakpoints when using websocket?
Imagine you have websocket functionality. In my case I worked on project where where this lib was used http://socketo.me/ . And docker, symfony. Socket server is started by going to docker container and running command
bin/console app:socket:start-serverThen when user clicks some button, javascript sends socket message and that socket server runs some other command like “bin/console some-command” depending on the message which it received. So I wanted to have breakpoints working in that some-command.
Even when had environment variable PHP_IDE_CONFIG was set as I wrote earlier, it was still giving error
“Cannot find file ‘/var/www/pmp/bin/console’ locally.”
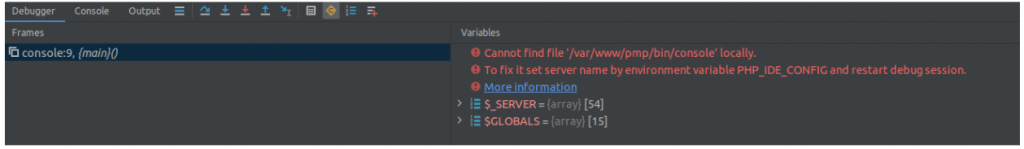
“To fix it set server name by environment variable PHP_IDE_CONFIG and restart debug session.”
Many times I tried to fix it, plus I had fixed this problem some time ago not even understanding how I did it so, I could not write in my notes for next time. Finnally one day I needed to work with socket functionality and it was so hard to debug without xdebug. I decided to give a try again to fix this problem. And idea poped to my head – what if I do what it says, but in the same terminal where I run the command to start socket server. And it works. So now I think it has something to do that it needs to see that environment variable in the same terminal, it probably does not see when this export is done in another terminal.
So just connect to docker container, in same terminal export the environment variable and then start socket server.
Breakoints work not only in the “some-command” which is executed by socket server but also it stops on code which is handled by bin/console app:socket:start-server itself. So this is nice.
So that’s how I could fix it one day without understanding – I accidentally exported that env variable in same terminal probably and it worked.
What I have wrote might not be very clear to those who do not have set up like this. Ideally I would need to setup and show mini application demonstrating this but it takes time, so at least now not doing that. Just having such idea might help for somebody to solve this issue I think.
Final words
There have been more problems with Xdebug for me but I wrote here recent ones because I remember well how things went, how I solved them. If I will get new problems, I might add more info. Maybe even those few words migth be useful for somebody.
So far I used configs from xdebug 2. If you are using xdebug 3, you can check for equivalent configs here: https://xdebug.org/docs/upgrade_guide .
Good luck!
Noticed just now, thanks 🙂 You are the first commenter, that feels nice to get comment to my blog 🙂
Thx